Changing Course
Share this blog
Latest Maritime Vacancies
Global HR Director – Europe
Claims & Insurance Manager (Part-time) – London
Legal Counsel (Marine Operations) – London
Insurance Executive – Singapore
Operational and Commercial Pricing Analyst- London
China's seaborne trade: a spectacular upwards trend
"Brisk growth in China’s enormous seaborne trade has resumed over the past couple of years, following an earlier sharp slowing of the upwards trend. Potential for further expansion ahead is still visible, but it is not easy to foresee precisely how some aspects will evolve. Adding to the mix a trade dispute with adverse implications magnifies uncertainty about prospects.
The evolution of this global seaborne trade component is particularly fascinating, given its extra-large size and its substantial contribution to overall trade expansion. China’s imports have grown to comprise more than one-fifth of the world total. During the past decade, half of the rise in global cargo volumes moved was contributed by additional import volumes into China.
Shipping story of the century
Although identification of the most significant twenty-first century shipping story is to some extent a matter of opinion, the impact of China’s expanding seaborne trade is in strong contention for the title. The ramifications for both the demand and, in turn, supply sides of the world shipping market have been massive.
Rising imports into China were a powerful contributor to the pre-2008 period of strong global shipping markets. The extended dry bulk freight market ‘boom of two lifetimes’ ending in 2008 reflected this influence. Subsequently, during the past decade since that strong market phase, imports into China have provided valuable support for the bulk carrier, tanker, container ship and gas carrier markets. Arguably that support encouraged shipowners’ collective over-estimation of seaborne trade growth potential in the past ten years, resulting in excessive world fleet growth, severe over-capacity and subdued freight markets for most of the period.
A few statistics emphasise these observations. The main focus of attention is on the imports picture, as it is in this category where the biggest impact has been seen. Among exporters, China is also a sizeable element which has grown during the past decade and over a longer period, but this enlargement was relatively small.
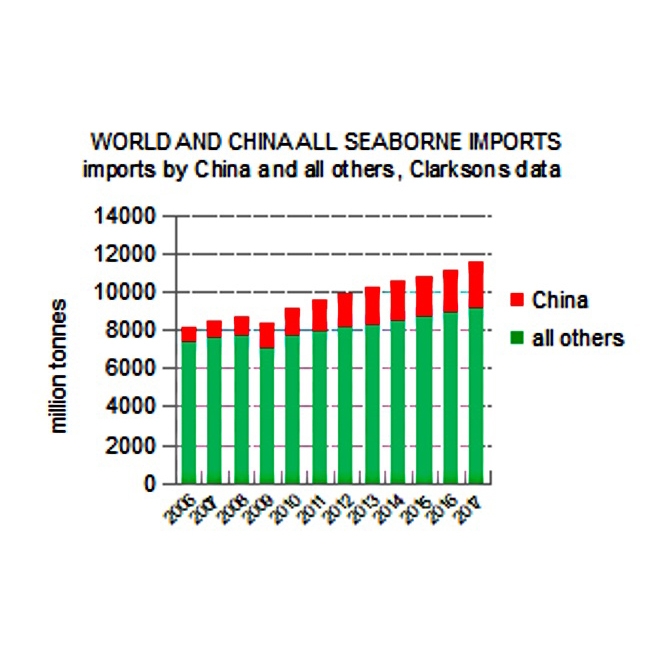
The upwards trend in imports has been remarkable. In 2017, seaborne imports of all types of cargo into China (dry bulk commodities, oil, gas, containerised shipments and other cargoes) grew by 182 million tonnes or 8 percent from the previous year according to Clarksons Research calculations. This increase followed a 7 percent rise in 2016.
Annual growth rates in the past ten years varied between 1 percent in 2015 (the slowest) and 37 percent in 2009 (the fastest). The 2009 upsurge was an exceptional year, resulting from vigorous expansion of the Chinese economy and industry which greatly assisted the world’s recovery from depression. Apart from that unusual performance, the highest growth rates in China’s imports of all cargo types were in 2011 to 2013, when 11-12 percent annual rises were seen. Average annual growth in the entire 2007 to 2017 period was 10.2 percent.
Bumper imports, solid exports
Looking in more detail at the expansion over the past decade reinforces an impression of a truly remarkable upwards trend. Annual imports of all seaborne cargoes into China rose by 163 percent from the 2007 volume, reaching 2437mt in 2017. Dry bulk commodity imports, the largest element, was the fastest growing category over the ten years, expanding by 191 percent to 1730mt. The second largest component, oil (crude plus products), saw a 129 percent increase to 416mt. In the containerised goods segment, growth was 43 percent to 117mt. All other cargo together increased by 149 percent to 175mt.
Relating the expansion of China’s overall imports to the performance of world seaborne trade as a whole is revealing. Annual imports of all types of cargo into China grew by 1510mt in the ten years ending 2017, equivalent to 49 percent of world imports growth, based on Clarksons Research data. Annual imports into all other countries together grew by 1593mt, or 51 percent of world imports growth. So it can be seen that China contributed almost as much to the enlargement of global trade as other countries together during that period.
Consequently, China’s imports (all cargo types) rose as a percentage of global seaborne trade. From 11 percent of the world total in 2007 (and, earlier, 5-6 percent in the early 2000s), the proportion almost doubled to a 21 percent share in 2017.
Comparing exports with imports, export volumes are less than one quarter of the imports totals. Growth in China’s annual seaborne exports of all cargoes was a modest 19 percent during the past ten years. The total reached 563mt in 2017. There was a 3 percent decline last year after a couple of modest rises. The largest category is dry bulk cargoes, comprising two-fifths, while container cargoes are almost as large.
This brief statistical tour demonstrates the role of China, with an enlarged share of global seaborne trade. Coupled with providing one-half of the increased global trade volume during the past decade, the attention which the trend attracts in shipping markets is justified.
Powerful macro-economic drivers
Several general, and some more specific, influences have been instrumental in buoying up the vigorous China trade trend. Assisting this pattern was the all-pervading influence of the national economy’s robust progress, and the features of that sustained performance.
While showing a decelerating trend over the past decade, China’s economy nevertheless avoided any extended severely weak periods and momentum was mostly well-supported. There were phases where anxiety (especially among external observers) about prospects was heightened by signs of negative influences becoming more prominent. Firmer conditions were restored, usually with assistance from government stimulus programmes and, based on the official GDP figures, any deterioration was contained.
Double-digit annual percentage rises in GDP ended, with one exception, before the global financial crisis and recession. But even at the nadir of that crisis in 2008 and 2009, China was able to achieve healthy 9.6 percent and 9.2 percent annual growth respectively, albeit a sharp slowdown from 14.2 percent in 2007. The exception to the subsequent pattern of below ten percent rates was a brief revival to 10.6 percent in 2010 when the world was recovering.
Thereafter a slackening trend became entrenched. After a still robust 9.5 percent in 2011, slower growth became the norm. From 2012 to 2014 an annual average 7.7 percent was recorded, followed by a 6.8 percent average from 2015 to 2017. Other economic activity indicators in China were broadly consistent with this evolving pattern. Despite doubts among external economists about how accurately reported Chinese official GDP figures reflect the true picture of economic activity unfolding, it has been clear that many large components have continued growing strongly, with variations.
Modifying aspects
What other, more direct, influences have contributed to China’s seaborne trade trend? Mostly these influences have been positive. Growing imports reflected vigorous consumption trends as expanding demand for the products of individual industries spurred rising output volumes. When domestic production of the raw materials – such as iron ore, coal, crude oil and gas – proved increasingly inadequate, imports were needed on an enlarging scale. Foreign supplies were often more competitive than domestic supplies, resulting from superior quality or lower cost, or both.
In several trades also a need to accumulate inventories reinforced the prevailing upwards trend. Some stockbuilding seems to have mainly arisen because of the commercial imperative to ensure that supplies could be maintained if any temporary trade disruption occurred. Accompanying this reason, the government’s policy of building large strategic stocks further boosted imports. Constructing extensive crude oil storage capacity has been an especially notable feature, and progressively filling these facilities had a big impact.
Another aspect of government action is energy policy. The effects on fuel imports have been mixed. China has been moving steadily towards cleaner energy sources in recent years, attempting to reduce reliance on coal-burning, with negative implications for imports. While coal remains the largest energy provider, the alternatives of natural gas, together with renewable wind and solar power are now promoted heavily, and hydro-power and nuclear power also are favoured. Intensifying pressure to reduce excessively severe air pollution in cities and towns justified these policy aims.
Government policy in the agriculture sector has caused some significant effects. Limited support for domestic soyabeans production resulted in an enhanced role for imports, the largest individual agricultural commodity volume imported by China. Raising official strategic soya stocks provided an additional boost. By contrast, government policy during the past couple of years of reducing excessive corn stocks has been reflected in restrained grains imports for livestock feed.
Evolving individual trades
When individual categories of China’s seaborne trade are examined more closely, several features emerge. Within the imports trades group, dry bulk commodities are the dominant element, comprising 71 percent of the overall total in 2017. Of the remainder, oil is the second largest with 17 percent, followed by container volumes at 5 percent and other cargoes 7 percent. Within the exports trades group, major items include containerised manufactured goods, dry bulk commodities of which steel products comprise the largest portion, and processed oil products.
At the forefront of trade expansion, dry bulk commodity imports have been the star performer, contributing dramatic growth during the past decade. In particular iron ore has become, by far, the biggest single component, and now comprises over two-fifths of China’s entire imports of all types based on last year’s volume. Within the dry bulk group total, iron ore comprises three-fifths. Other prominent dry bulks are coal, grain and oilseeds (especially soyabeans), bauxite and alumina, nickel and other ores, and forest products.
Iron ore imports in the past two years have exceeded one billion tonnes annually, the seaborne total reaching 1.06bn in 2017, an almost threefold rise in the annual volume during the past decade. This upwards trend reflected rising steel production and growth in ore usage, amid strengthening demand for steel from construction activities and manufacturing industries. Annual crude steel production in China rose by 70 percent in the past ten years, to 832mt in 2017. An evolving preference for high-quality ore from foreign suppliers, progressively displacing lower-quality domestic iron ore supplies, further boosted imports.
Rapid growth in coal imports was seen over the five years ending in 2013, since when annual totals have been lower than the peak. In 2016 and 2017, volumes of about 227-230mt annually were more than five times levels seen a decade earlier. Steam coal for power stations is the biggest market. Overseas supplies were often more competitive than output from China’s domestic mines, which produce coal on a vast scale. Changes in consumption patterns, stocks, and government policies also had an impact on imports. Measures taken to reduce coal usage for environmental reasons have been a significant restraint recently.
Within the grain and oilseeds category, the largest part is soyabeans, which have been on a strongly rising trend. Seaborne grains and soyabeans imports reached 116mt in 2017, more than threefold growth compared with the volume ten years earlier. Expanding soyameal consumption by livestock feed producers, and soyaoil use in food manufacturing, was mostly facilitated by importing beans for crushing, because Chinese domestic beans harvests are relatively small.
Over ninety percent of China’s seaborne oil imports totalling 416mt last year consisted of crude oil, amounting to 386mt. The overall total was more than double the volume received a decade earlier but growth was concentrated in the crude portion. By contrast oil products imports declined, amid expanding refinery capacity which also enabled higher products shipments to export markets. Vigorously growing consumption by road vehicles and in the petrochemical industry, coupled with limited domestic oil output growth, propelled the imports trend.
Although containerised exports from China are the most highly visible part of world trade, containerised imports also are voluminous. Defined in Clarksons Research statistics as ‘containerisable’ cargoes, seaborne imports last year were about half the level of container exports which totalled 234mt. While annual imports grew by 43 percent in the past decade, exports grew similarly by 45 percent. This extensive trade is mainly comprised of manufactured or semi manufactured items of many types and varieties, reflecting China’s role as one of the top manufacturing countries.
Another notable trade contributor is liquefied natural gas (LNG) imports. These rose to 38mt in 2017, from 3mt ten years earlier, a rapid ascent including a more than doubling over the past four years as greater emphasis was placed on cleaner energy sources, and new liquefaction plants began operating. Gas is consumed mostly in power stations and by residential users.
Expansionary drivers slackening?
How are these trends likely to evolve in the future? For the global shipping industry as a whole, further growth in China’s seaborne trade is seen as a potentially highly valuable contributor to freight market viability. Among shipowners in particular the rationale underlying capacity investment strategies is often, implicitly or explicitly, based on an assumption that the broad direction of trade and especially import demand in China will remain positive.
Many forecasters share this essentially upbeat outlook, although degrees of optimism vary. Expectations for the short-term period of twelve months or so ahead often suggest significant increases in volumes in numerous China trades. More distant future views, while maintaining a generally positive stance, are inevitably more hazy, reflecting the great imponderables and uncertainties surrounding not only events in China but around the world.
Among the main import trades into China, on which the global shipping industry has become heavily dependent, growth prospects are not uniformly favourable. In several commodity sectors it is relatively easy to justify predictions of continuing imports increases, although often difficult to quantify the likely magnitude. Elsewhere, assumptions of sustained growth are not necessarily so solid: flat or downwards trends can be envisaged, and are perhaps more realistically foreseen by cautious observers.
One factor adding complexity is the fairly frequent government policy changes which have a noticeable impact on China’s trade movements. Numerous changes have a tendency to be unpredictable to a large extent, magnifying uncertainty, as political influences are opaque. Some changes can be broadly envisaged as possibilities, but probability of introduction, scope and timing cannot be reliably estimated. Consequently in these instances forecasting is speculative.
Coal imports are sometimes seen as an example of a trade which is more likely to go down than up, especially in the longer term, given the negative pressures evident. Imports are a relatively small element of China’s domestic coal market with about 7 percent currently, but seem vulnerable to reduction. Although coal is likely to remain dominant among energy supplies for many years, measures to curb consumption within the national anti-pollution strategy suggest unfavourable circumstances for foreign suppliers.
A contrasting example is LNG imports where an upwards trend is clearly foreseeable. As a cleaner energy source, natural gas consumption in China is set to increase over the years ahead. LNG demand will be shaped also by domestic gas production and pipeline gas imports, but estimates point to strong growth. According to recent estimates by the Australian Government, annual LNG imports into China could rise cumulatively by 54 percent over the next three years.
Underlying the prognostications for all seaborne trade elements are various assumptions about the outlook for China’s economy, its growth rate and pattern of progress. Despite potential for setbacks, most forecasts do not predict any severe downturn and suggest only a gradual slowing trend. This long-established expectation reflects the Chinese government’s objectives. Shifting the economy away from excessive reliance on investment and manufacturing, and towards consumer spending and services is a policy intention, implying an overall slowing. While the Belt and Road Initiative could provide additional support, the contribution awaits clarification.
The recent emergence of trade disputes creates additional anxiety. If the USA’s quarrel with China remains unresolved, or leads to a widening round of protectionist moves, consequences could be severe. Predictions are mostly not based on this view. Forecasts assume that China’s economy can sustain a reasonably healthy enlargement, with only a gradual shift towards sectors where commodity consumption is much lower. Such a view implies potential for incremental seaborne cargo movements, albeit at a slower growth pace than seen in the recent past."
Article originally written for Hellenic Shipping News Worldwide (www.hellenicshippingnews.com) by Richard Scott, Associate, China Centre (Maritime), Solent University and Managing Director, Bulk Shipping Analysis