Changing Course
Share this blog
Latest Maritime Vacancies
Business Development – Shipmanagement – Dubai
Office Manager – London
Shipping Paralegal – London
Shipping Manager – Singapore
Office Administrator – London
Change for the bulk shipping industry
The global bulk shipping industry is currently undergoing a fundamental change. It has been, and still mostly is, dominated by principal-led, family-owned companies, funded mainly by commercial banking. However, following the financial crisis and the extended downturn in charter rates, vessel values and traditional bank lending, alternative sources of finance particularly private equity and hedge funds, have become increasingly prevalent in the sector.
The new money has been particularly attracted to the distressed nature of many shipping companies, loans and assets. Values for most cargo vessels reached historical lows in 2013 from the market highs reached in 2008. Values rebounded after improvements in earnings in late 2013, but ships remain keenly priced.
Advances in financial modelling are making market timing and asset allocation decisions in the shipping industry possible. Traditional sources of funding are less enthusiastic about lending to shipping, primarily due to the recent capital adequacy requirements coupled with the capital intensive and cyclical nature of the industry. This is the primary cause of the recent advent of “smart money”, where investors are lured in by the stable medium term fundamentals, positive short term outlook, contractual flexibility and the introduction of innovative structures.
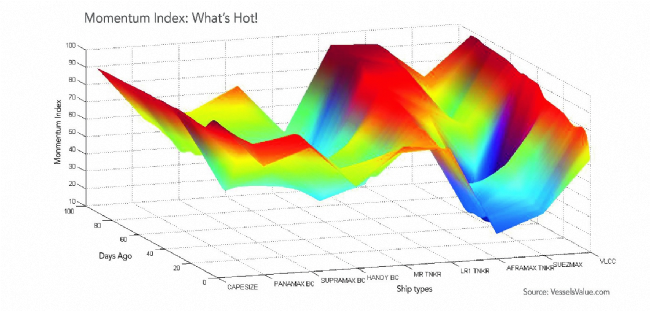
Tools and indicators that aid a participant in timing the markets, especially in times of high volatility, are much sought after. One such indicator is price momentum. This allows the participant to look for strong positive trends in prices over a specified period to support entry/exit decisions. The first image shows the quarterly momentum index for a Capesize vessel (the largest type of dry bulk ship, transporting iron ore, coal, grain, etc.) In this example, an index of 50 indicates that prices were increasing for half of the days in the quarter, so an index greater than 50 suggests a stronger positive trend in price.
In a weak market there is a strong likelihood of vessels being scrapped early. In a strong market, owners anticipating good returns are more willing to spend resources in extending the life of the vessel, and this is reflected in the shape of the curve. Scrapping activity, shown in the second image, is therefore a powerful indicator of market sentiment.
Additionally, speed of the global fleet and periods of congestion may affect the freight rates. The period of employment of a vessel compared to the global average may also reflect the operator’s capability to secure employment and minimize the empty ballast passage. The last image shows how the proportion of time spent by Capesize vessels at different navigational statues varied over a year, indicating seasonality of trade and changes in freight market conditions.
Summary
The amount of data available to all of us is growing at an exponential rate, and the ability to analyse it faster is more important than ever. We are seeing an increased appetite from all areas within shipping for high level analytics. The industry requires advanced algorithms, huge data, innovative analytics and cutting edge technology, while always being firmly grounded in commercial reality and application. Most importantly, it must be continuously updated, tested and optimised.
All reports and data can be ordered as part of VesselsValue.com bespoke consultancy module VVQ:
Customisable analytics, reports and tools for a deeper view on the market. These include; demand, supply, congestion, speed, trade flows, option/charter/ income valuations, operating performance, haircut/default models, volatility, momentum, correlation, bunker demand and fleet at risk.