Changing Course
Share this blog
Latest Maritime Vacancies
HR Director – Europe
International Recruiter – Europe
Finance Director – Europe
Marketing And Communications Manager – Europe
Maritime Data Sales – Europe
Newbuilding orders reflect shipowners’ cautious outlook

Article written exclusively for Spinnaker Global
by Richard Scott, member of London & South East Branch committee, Institute of Chartered Shipbrokers
Shipowners are not over-enthusiastic about ordering new ships in the present phase of the market. This remark is a broad generalisation, and trends in the main sectors vary, but data on global newbuilding orders confirms the impression. Moreover, an upsurge seems unlikely in the near future.
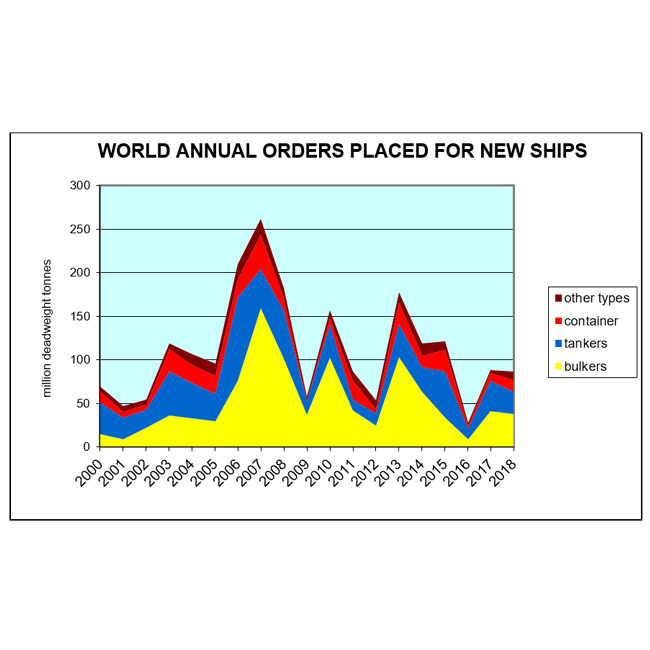
Compared with many previous periods, activity in the newbuilding market remains quite subdued. Since annual orders for merchant ships collapsed to a very low volume three years ago there has been a revival. The recovery has been limited, however, and ordering seen in the early weeks of 2019 amid other signs points to a continuation of that pattern in the immediate future.
During 2018 newbuilding orders for all commercial ship types, placed at shipyards around the world, totalled 87 million deadweight tonnes according to Clarksons Research, a figure which may be revised. This volume was 2 percent below the previous year’s 89m dwt total, although both years were well above the decade’s low in 2016 when only 28m dwt was recorded. In earlier years annual order volume were often at much higher levels, including totals exceeding 150m dwt in 2010 and 2013.
Looking at the entire world orderbook at the end of 2018, a ‘snapshot’ view including the new contracts added in the preceding twelve months, a total of 220m dwt is shown. When related to the world fleet of ships, this orderbook is equivalent to about 11 percent of existing tonnage.
Notably also, orderbooks for the main individual sectors – tankers, bulk carriers and container ships – as a proportion of respective fleets were all within a narrow 10-12 percent range. By contrast, the liquefied natural gas (LNG) carrier orderbook was a far larger 25 percent of existing tonnage.
Last year the inflow of fresh orders was somewhat above the outflow volume of newbuilding deliveries totalling 80m dwt. Attention now focuses on 2019. What is the likely volume of deliveries this year? Scheduled delivery dates for ships on order suggest that about half of the overall 220m dwt orderbook estimated at the end of last year was due for completion this year. Actual deliveries are usually well below the volume scheduled, for a variety of reasons. After making some provisional deductions for orderbook ‘slippage’, the 2019 deliveries total could be similar to last year’s volume.
The pattern of newbuilding ordering seen in the past few years and still apparently continuing reflects freight and asset market trends. Circumstances vary among the sectors, but common factors are identifiable. Investors’ mostly restrained attitude follows long periods of ‘difficult’ freight markets when good investment returns were elusive.
Over the past decade there were extended periods in tanker, bulk carrier, container ship and other segments when growth in seaborne trade volumes and vessel demand, on one side of the market, was exceeded by fleet growth and vessel supply on the other side. Low freight rates and returns resulted from these market imbalances. Together with more uncertainty about eventual sustainable recoveries, plans to expand capacity eventually were deterred.
Nevertheless, in the past three years some temporary newbuilding order surges in favoured vessel types were seen. Large vessel categories were popular with some investors, especially the very large crude carrier (vlcc), very large ore carrier (vloc), and very large container ship (vlbc). In specific periods other types including aframax tankers, kamsarmax bulk carriers, LNG carriers and mega-size cruise ships were featured.
Further lengthy adjustments may be needed to improve market balances. Investors’ foresee this process being aided in the period ahead by relatively low new capacity added. Less abundant finance availability may be contributing. Consequently greater ‘self-discipline’ in ordering patterns has evolved.